


1. |
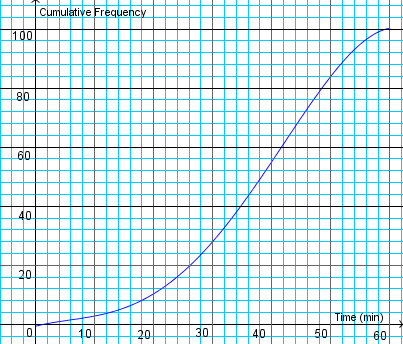
The cumulative frequency curve shows the times taken by 100 students to |
|
complete a test.Use the graph to find |
||
(a) the number of students who took less that
45 minutes to complete the test, |
||
(b) the percentage of students who took more than 50 minutes to complete the |
||
test. |
||
 |
||